Overview of Unit Exams
Unit Exams with KIPP New Orleans are regionally produced exams that connect learning over the course of the unit. They are produced by testing coordinators who are experts in content for each grade level, and are regionally used by all grade-level content teachers. These exams are based off of the nationally produced KIPP Vision for Math Instruction. This vision aligns all KIPP regions so that all exams are produced in a way that meets these vision standards. More information on the supports KIPP provides for educators in instruction can be found here. The unit exams are uploaded to a testing platform so that results are accurate and immediate. Results are also broken down into "Advanced, Mastery, Basic, Approaching Basic, and Unsatisfactory." In New Orleans, a score of Basic is considered mastery of the content. This simple break down of scores makes it easy to give families a report of their scholar's performance on any given unit test. It is also to give families a break down of what specifically their scholars need to work on to improve scores for their next testing performance.
Unit Test Sample
Below are two different perspectives on the same exam for Unit 4. To the left is the "teacher" edition of the unit test, highlighting specific standards tied to each question. It also highlights appropriate answer responses. To the right is the "student" view of the exam. You will see that there are multiple choice, constructed response, and short answer questions, giving students multiple testing methods within one unit test.
|
|
|
Unit Test Analysis Tools
Within the testing platform, I have multiple means of analysis on testing data. While it is easy to look at the "donut" and look for scholars who scored mastery or advanced, it is sometimes more helpful to look at standard mastery to note what specific subject matter was a challenge for the students. Below are samples of types of analysis.
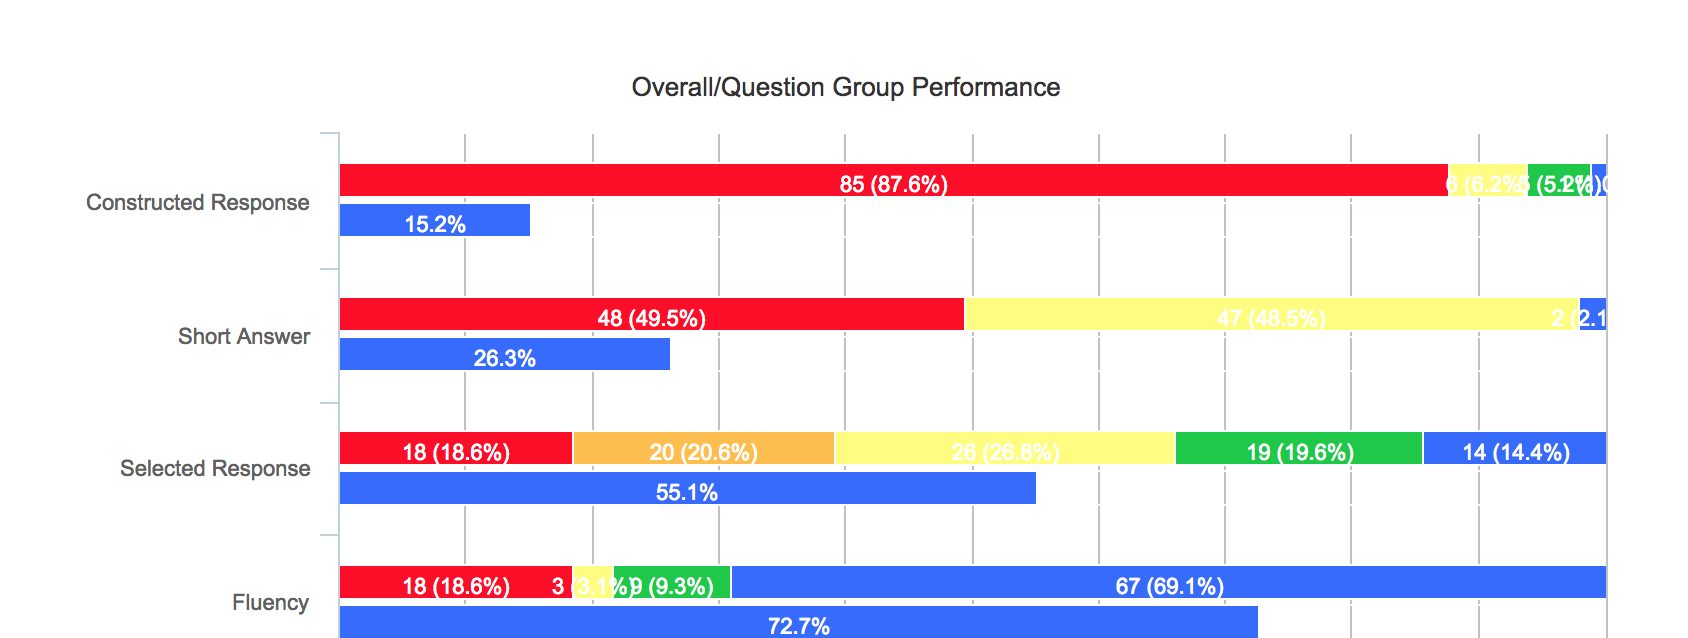
Students' mastery is shown based on the type of question answered. Blue, green, and yellow are mastery. Red and orange are unsatisfactoroy
|
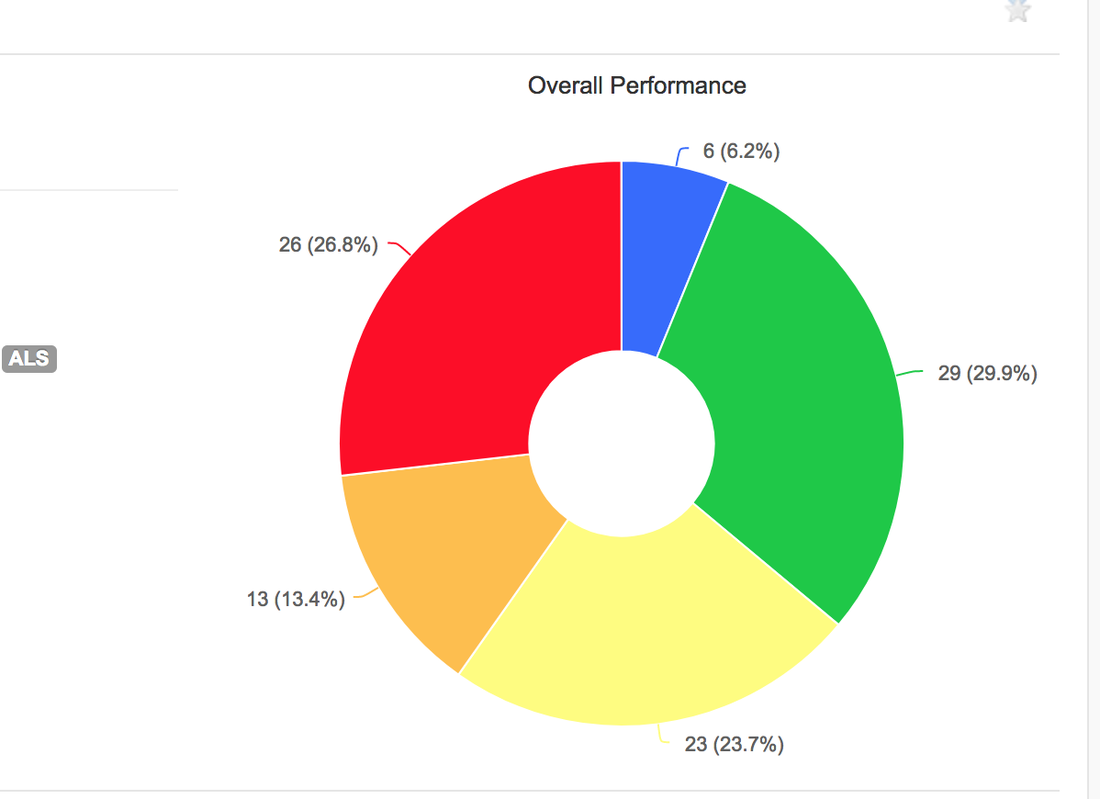
The "donut" is a quick and easy snapshot of how many scholars mastered the unit exam
|
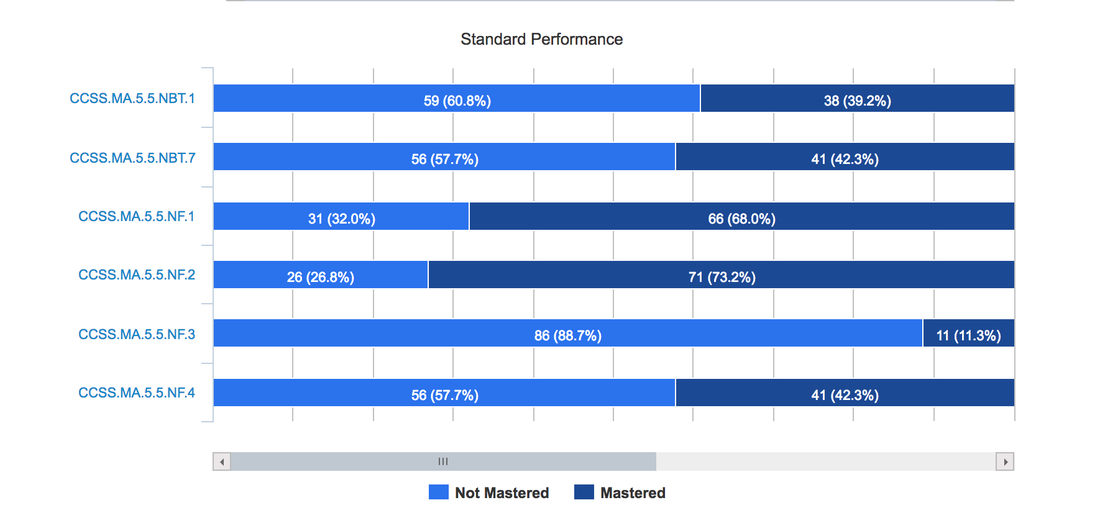
This graph highlights the standard mastery of each standard tested. Very helpful for intervention groupings. Dark blue is mastery, light blue is not mastered.
|
Data and Analysis
Overall Performance
Below I included the performance of my scholars on the last unit test of the year compared with the first. These tests were administered in August and April, and include most of the same standards (The last unit test has a decimal standard that wasn't on the first exam, but all others are equal). The data below shows that 60% of 5th graders in my math classes scored at a "Basic" or above. This means that 60% of the 5th grade mastered the subject matter for the last unit test of the year. I am proud to showcase how many scholars scored at the "Mastery" level (green coloring) for the last test as compared to the first unit test. These types of swings in growth are truly transformational and highlight a trend of effective teaching.
For Reference:
Blue- Advanced Level
Green- Mastery Level
Yellow- Basic Level (Passing)
Orange- Approaching Basic Level
Red- Unsatisfactory Level
For Reference:
Blue- Advanced Level
Green- Mastery Level
Yellow- Basic Level (Passing)
Orange- Approaching Basic Level
Red- Unsatisfactory Level
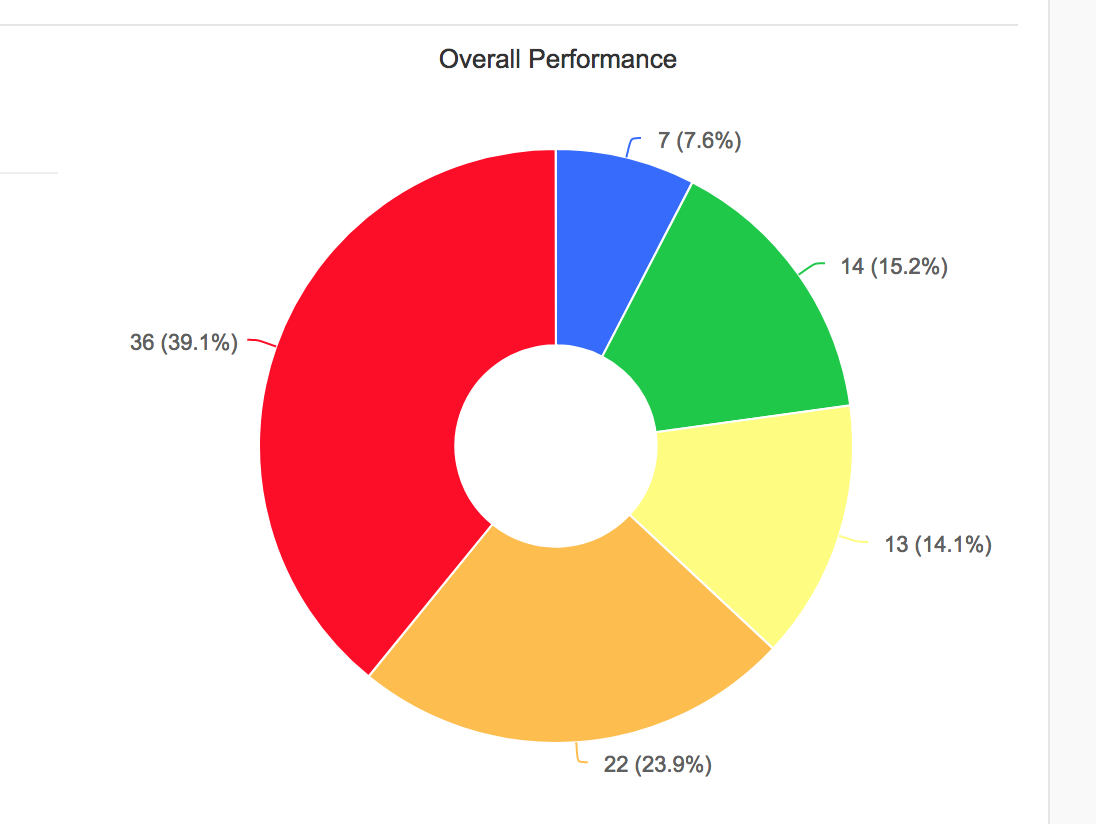
First Unit Test of the year. August 2017. 39% of the grade at Unsatisfactory (red) levels. Only 36% are at Basic or above.
|

Last Unit Test of the year. April 2018. 60% of scholars are at Basic or above (mastery of material).
|
When evaluating the data from Unit Tests, I chose to look at the percentage at Mastery for the year. It is clear from the overall performance bands that scholars mastered the material at much higher and more advanced levels at the end of the year. A majority of scholars performed at the "Basic" (yellow) band or above, while the number of unsatisfactory and approaching basic scholars dramatically decreased.
When I got the results back from the first unit assessment, I first noticed that there were 22 students who were "Approaching Basic." This means that these scholars are only a couple points away from achieving a "Basic" score. I targeted them for the first half of the year, making sure they were put into rigorous small groups and extra math intervention so that they would be able to make those few points up quickly. When the BOY and EOY tests are compared, the "Approaching Basic" category is about 10 students less and the "Basic" category is 10 students larger. This shows movement upwards.
The second half of the year showed a focus on bringing my "Unsatisfactory" students up to the same playing field. By comparing scores, I took the 10-15 "Unsatisfactory" students with the closest scores to move and worked intensively with them during our extra math intervention block. Students stayed for tutoring after school and were given much more intensive math instruction during class. As the charts compare, 10 students moved out of the Unsatisfactory category.
When I got the results back from my last unit exam (shown above), I was very excited. Not only did the number of unsatisfactory students drop, but my levels of mastery and basic grew as well! When I began to dive deeper into analysis, I realized that the standards that were the most "mastered" were those that were focus standards for the year. In other words, the standards that are vital for mastery of 5th grade content were mastered by my students in overwhelming numbers. Other standards that were not the focus of the year had slightly less mastery, but again, were not the focus of the year for my students. This growth happened thanks to targeted intervention block each day in response to exit ticket and exam data, after school tutoring, and extra communication to families about progress!
Standard Performance Highlights
At the beginning of the year and at the end of the year, my students were tested on the Common Core Standard NF.1. The standard reads, "Add and subtract fractions with unlike denominators (including mixed numbers) by replacing given fractions with equivalent fractions in such a way as to produce an equivalent sum or difference of fractions with like denominators." Below you can see the drastic growth that my scholars made in one of the anchor standards of 5th grade. This is a focus standard, as scholars must have a strong grasp of adding fractions with unlike denominators before they can move to 6th grade work.
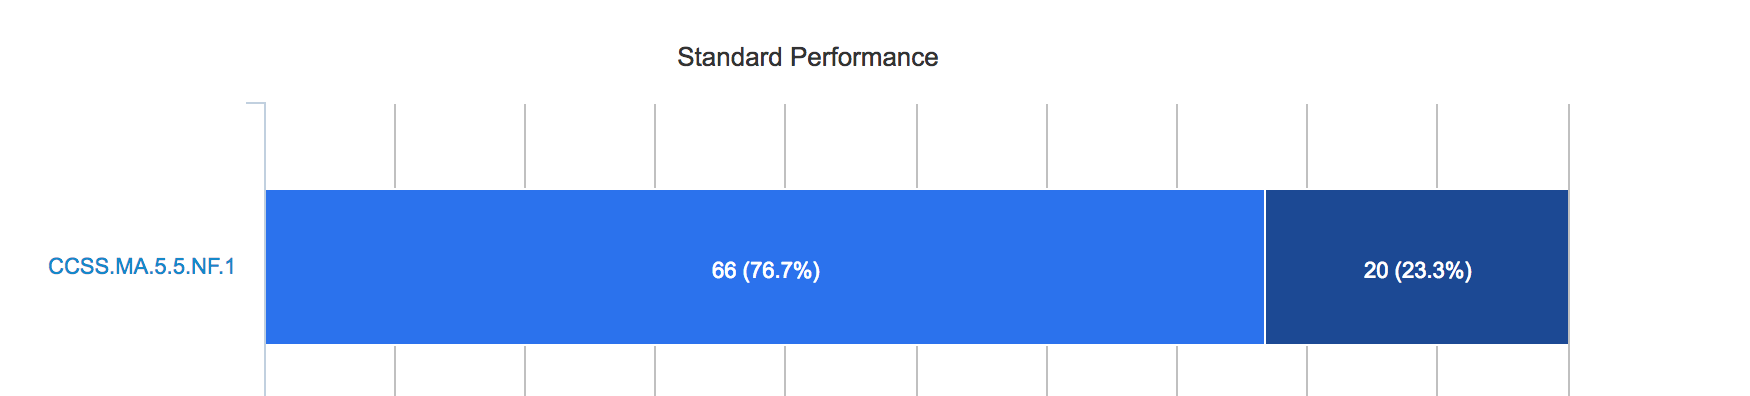
BOY: August assessment: Light blue represents students who have NOT mastered the standard. Dark blue represents mastery.
|
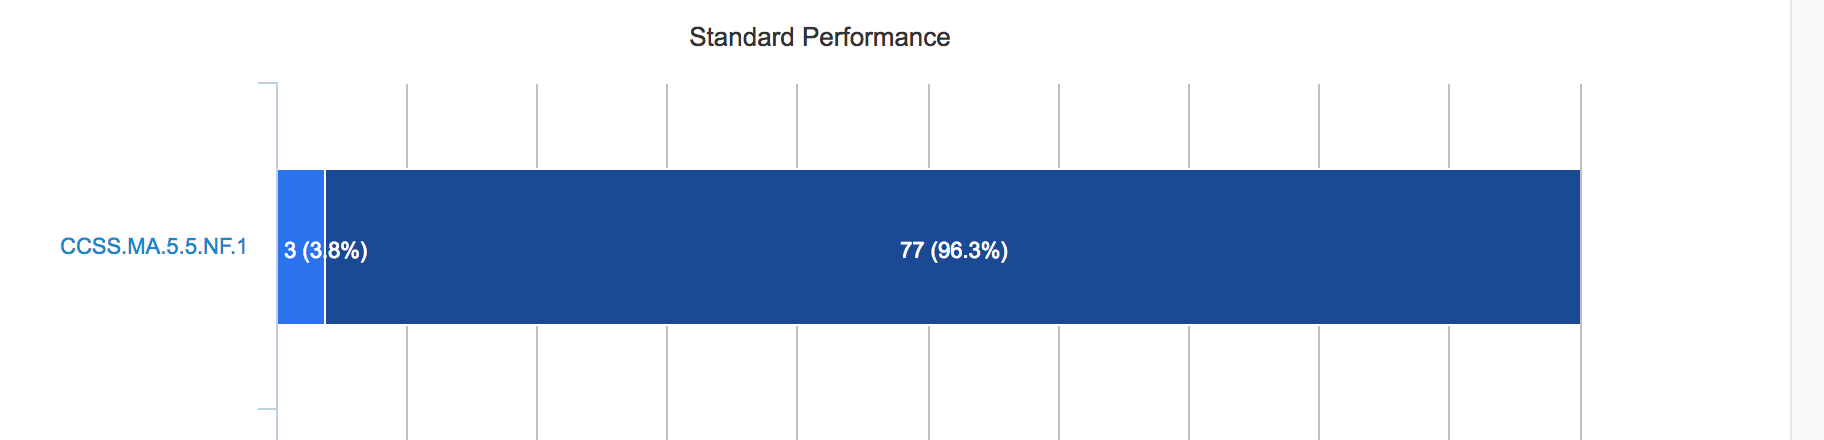
EOY: April assessment:
Light blue represents students who have NOT mastered the standard. Dark blue represents mastery.
|
Individual Student Highlights
Below are the BOY and EOY scores from scholars who made transformational academic growth! All three scholars started the year with scores in the Unsatisfactory (Red) or Approaching Basic (Orange) levels. This denotes that they are below grade level standard performance. Each of these scholars was at Advanced (Blue) level by year-end. To move this far in a positive direction and to be this much higher over the "average" 5th grade student is truly transformational, and highlights the dramatic academic growth scholars made in my classroom this year. *Names have been blacked out for student privacy.

JA began the year with an Approaching Basic, only answering 10 of 27 questions correctly

RH began the year at an Unsatisfactory level, only answering 5 of 27 questions correctly.

JF began the year with an Approaching Basic, answering 11 of 27 questions correctly
|

JA ended the year with an Advanced, answering 21 of 26 questions correctly!

RH ended the year with an Advanced, answering 22 of 26 questions correctly!

JF ended the year with an Advanced, answering 21 of 26 questions correctly!
|
Conclusion
It is clear, through a look at the last Unit Test, that my scholars produced dramatic academic growth from the beginning to the end of the year. Almost 70% of scholars mastered the material by the end of the year, and even more were almost at mastery. When comparing that data to the beginning of the year, we can see that 24 students moved from unsatisfactory levels of performance to mastery! That's a huge number, especially when looking at the numbers as a whole.
Furthermore, standards comparison with a focus standard for our grade showed massive improvements of over 70% mastery when analyzed. Scholars moved from 23 to 96% mastery by end of year testing. By focusing attention on these important standards and targeting them during daily "Do Nows" and constructed response practice, scholars began to understand the standard at a more conceptual level, thus improving their mastery of the content.
I highlighted three students who made truly transformational academic growth from August to April. Moving from Unsatisfactory to Advanced is almost unheard of. These three students, through rigorous intervention blocks, reteach lessons, and strategic classroom work, showed that dramatic academic growth was common in my classroom.
Dramatic academic growth focuses on moving students to mastery, and the data above shows that my classroom produced the levels of growth that support transformational teachers.
